Basking Sharks

Where to spot them in West Scotland

Analysis by Jason Muteham

Basking Shark

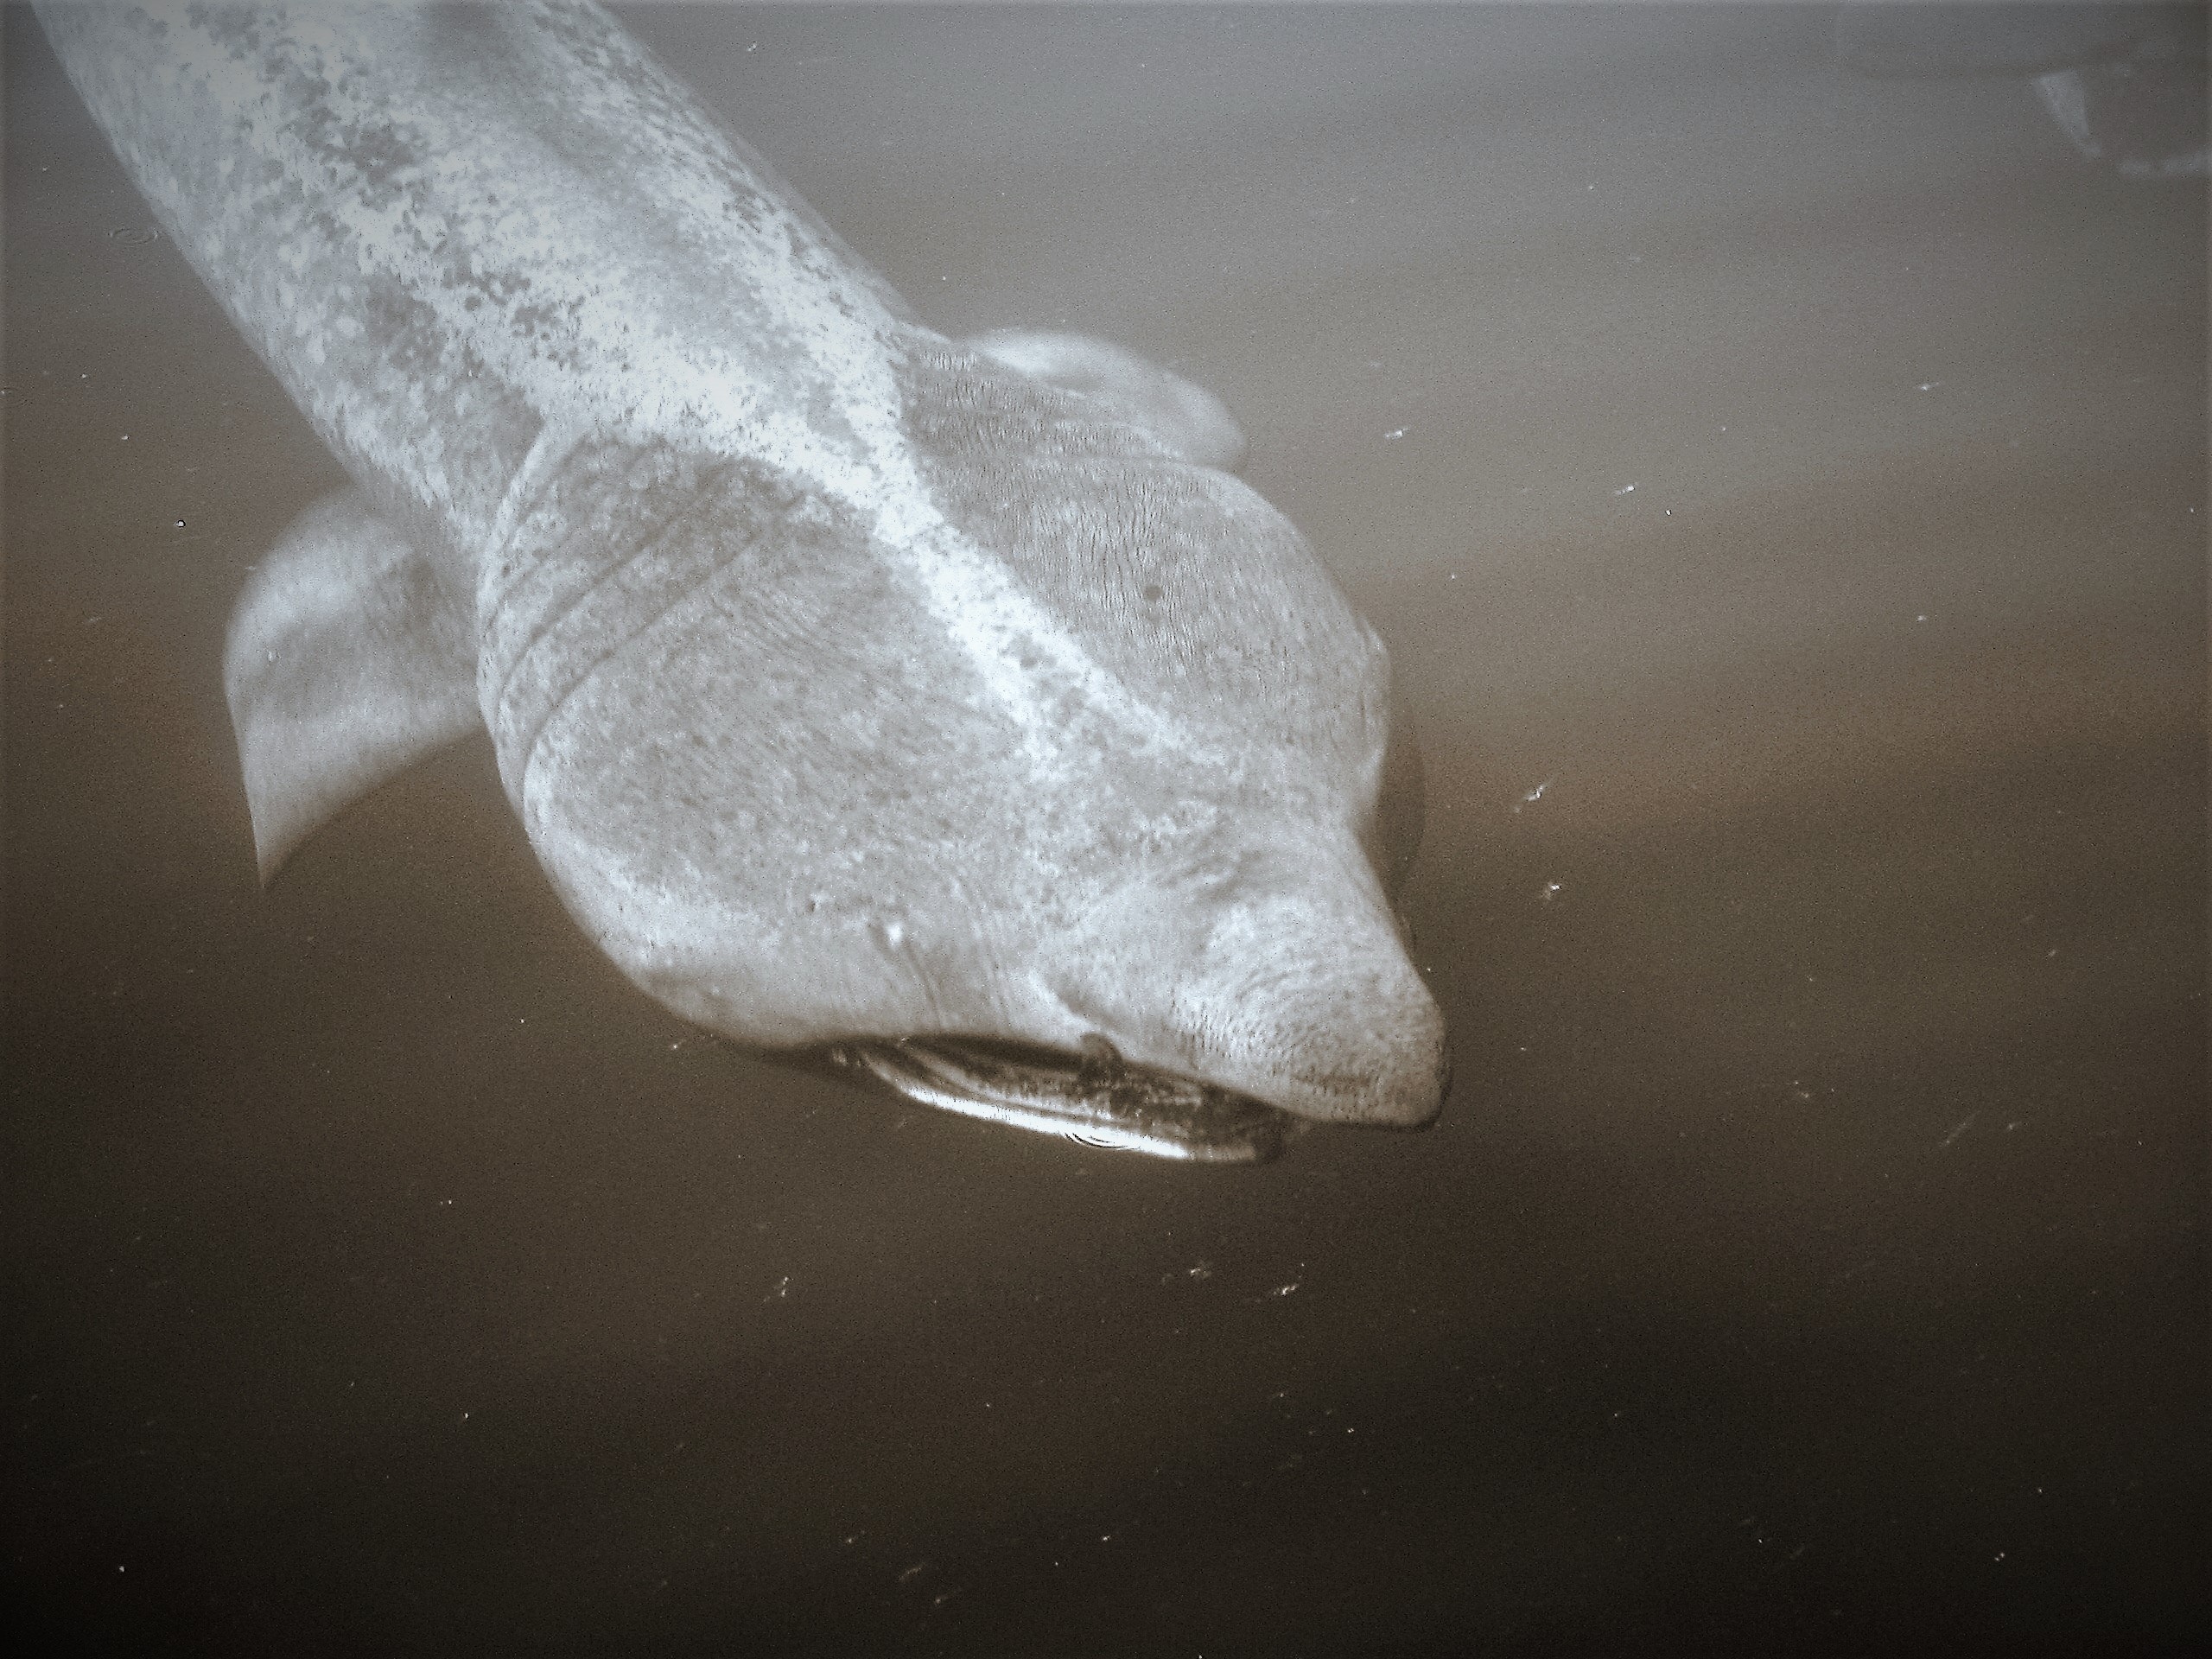
Photo by Jason Muteham


Questions answered in this report

  • How many Basking sharks have been observed by the Hebridean Whale and Dolphin Trust?
  • Where is the best location to see Basking sharks?

This notebook analyses the wrangled data created in the notebook HWDT Data Wrangle.ipynb


Hebridean Whale and Dolphin Trust

Based on the Isle of Mull, in the heart of the Hebrides, HWDT has been leading the way for the conservation of whales, dolphins and porpoises in the waters of western Scotland for over two decades.

We believe evidence is the foundation of effective conservation. Our research has critically advanced the understanding of species that visit seasonally or are resident in the Hebrides. Data are provided to the Scottish Government to inform protection measures for minke whales, Risso’s dolphins, harbour porpoises, and basking sharks across Hebridean seas.


Data provided by the following providers:

  • Records provided by Hebridean Whale and Dolphin Trust, accessed through NBN Atlas website. (2022). For more information: email info@hwdt.org, or https://registry.nbnatlas.org/public/show/dp81
  • Hebridean Whale and Dolphin Trust (2022). Visual sightings data set 2003-2021. Occurrence dataset on the NBN Atlas (Creative Commons, with Attribution, Non-commercial v4.0 (CC-BY-NC) CC-BY-NC). For more information: email biodiversityofficer@hwdt.org, or https://registry.nbnatlas.org/public/show/dr537

Imports

In [ ]:
#%%capture
#!pip install OSGridConverter
import pandas as pd
import plotly.express as px
import plotly.io as pio 
import plotly.figure_factory as ff
from OSGridConverter import grid2latlong
pio.renderers.default = "vscode+notebook"

Parameter setup

Constants

In [ ]:
import_file = 'Data/export-2022.csv'
name = "Basking Shark"
# Which OS bins to use for the maps
ll_OSGbin = 'OSG 1km'
#"open-street-map", "carto-positron", "carto-darkmatter", "stamen-terrain", "stamen-toner" or "stamen-watercolor"
px_map_tiles = 'carto-darkmatter'
mg = dict(l=20, r=20, b=20, t=100)

Fuctions

In [ ]:
# Create df group by OSGbin
def OSGbiner(OSGbin):
  df_tmp = dw.groupby([OSGbin,'Common name'])['Individual count'].sum()
  df_tmp = df_tmp.reset_index()
  df_tmp = df_tmp.pivot_table(index=OSGbin, values='Individual count', columns='Common name')
  df_tmp = df_tmp.fillna(0)
  df_tmp['Total'] = df_tmp.agg('sum', axis=1)
  df_tmp = df_tmp.sort_values(by='Total')
  return df_tmp

Import Data

In [ ]:
dw = pd.read_csv(import_file, parse_dates=["Date"])

Q. How many Basking sharks have been observed by HWDT?


In [ ]:
fig = px.bar(dw.query('`Common name` == "Basking Shark"').groupby('Date year')['Individual count'].agg('sum'),
    y='Individual count', title= 'The number of ' + name + "s spotted each year", text_auto=True, height=500,)
fig.update_layout(yaxis_title='Count of ' + name + 's', xaxis_title='', showlegend=False)
fig.update_traces(hovertemplate=' Year %{x}, %{y} spotted',marker_line_color='darkgreen', marker_line_width=1.0)
fig.show()
In [ ]:
print(dw[dw["Common name"] == name].groupby('Common name')['Individual count'].agg('sum'))
Common name
Basking Shark    1979.0
Name: Individual count, dtype: float64

A. A total of 1979 Basking Sharks have been observed by the HWDT between 2003 & 2021.

The peak year for sightings was 2010 there has been a sharp decline in observation since 2016. As the HWDT collects observation from members of the public COVID-19 restrictions could play a part in the 2020 & 2021 figures.


Q. Where is the best location to see Basking sharks?


In [ ]:
fig = px.density_mapbox(dw[dw['Common name']==name], lat='Latitude',lon='Longitude', z='Individual count', 
    radius=20, center=dict(lat=56.5, lon=-6.5), color_continuous_scale='blues_r', zoom=6, mapbox_style=px_map_tiles,
    title = 'Heat map of ' + name + ' observations between 2003-2021', height=670)
fig.update_coloraxes(cmax=30, cmin=1, showscale=False)
fig.update_layout(margin=mg)
fig.update_traces(hovertemplate='%{z} Basking Sharks') 
fig.show()
In [ ]:
# Build Low level plot data
df_bin = OSGbiner(ll_OSGbin)
dw_plot = df_bin.loc[df_bin[name] > 0][[name]]
dw_plot.columns = ["Total"]
max_osgrid = dw_plot.loc[dw_plot['Total'].max()==dw_plot['Total']].reset_index().iloc[0,0]
lats = []
longs = []
for idx in dw_plot.index:
    lalo = grid2latlong(idx)
    lats.append(lalo.latitude)
    longs.append(lalo.longitude)
dw_plot['Latitude'] = lats
dw_plot['Longitude'] = longs
dw_plot_low = dw_plot.copy()
In [ ]:
# Plotly Bubble Map
cp = {'lat':56.5,'lon':-6.7}
plot_size = dw_plot['Total']
fig = px.scatter_mapbox(dw_plot_low, lat="Latitude", lon="Longitude", center=cp, color=plot_size, color_continuous_scale='blues_r',
    opacity=0.8, zoom=8, size="Total", size_max=16, title=name+' hot spots 2003-2021', height=670,labels={"color": name+'s',"Total":name+'s',"Latitude":name+'s',"Longitude":name+'s'})
fig.update_coloraxes(colorbar_ticklabelposition='inside',colorbar_ticks='inside',cmax=20,cmin=1,showscale=False)
fig.update_layout(mapbox_style=px_map_tiles,margin=mg)
#fig.update_traces(hovertemplate='%{y}, %{color}') 
fig.show()

A. The majority of Basking Shark observations have been made in the waters around the islands of Col and Tiree, which would suggest that these islands would be a good starting place to encounter Basking Sharks.